Caffeine (1,3,7-trimethylxanthine) is one of the most widely consumed psychoactive compounds worldwide, occurring naturally in multiple plants. Its stimulant properties contribute to increased alertness and reduced fatigue, making it a common ingredient in beverages (Figure 1).
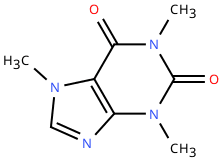
Figure 1. Structure of a caffeine molecule.
Several analytical techniques have been employed for determining caffeine content in beverages, including high-performance liquid chromatography (HPLC), gas chromatography and capillary electrophoresis.1 While these methods offer excellent sensitivity and accuracy, they often require specialised instrumentation, extensive sample preparation, and higher operational costs.
UV-Vis spectroscopy represents an attractive alternative due to its simplicity, rapid analysis time and low operating cost.2 Caffeine exhibits strong absorption in the ultraviolet region, with a characteristic absorption maximum near 270 nm.3 In this Application Note, caffeine levels in black tea, instant coffee, Coca-Cola and a Celsius energy drink were investigated using UV-Vis spectroscopy combined with a standard-addition approach. This methodology eliminates the need for solvent extraction, reducing sample preparation time while providing reliable quantitative information.
In this Application Note, an Edinburgh Analytical DB30 UV-Vis Spectrophotometer was used to measure caffeine at 270 nm and determine caffeine concentrations in a range of commercial beverages using a standard-addition methodology (Figure 2).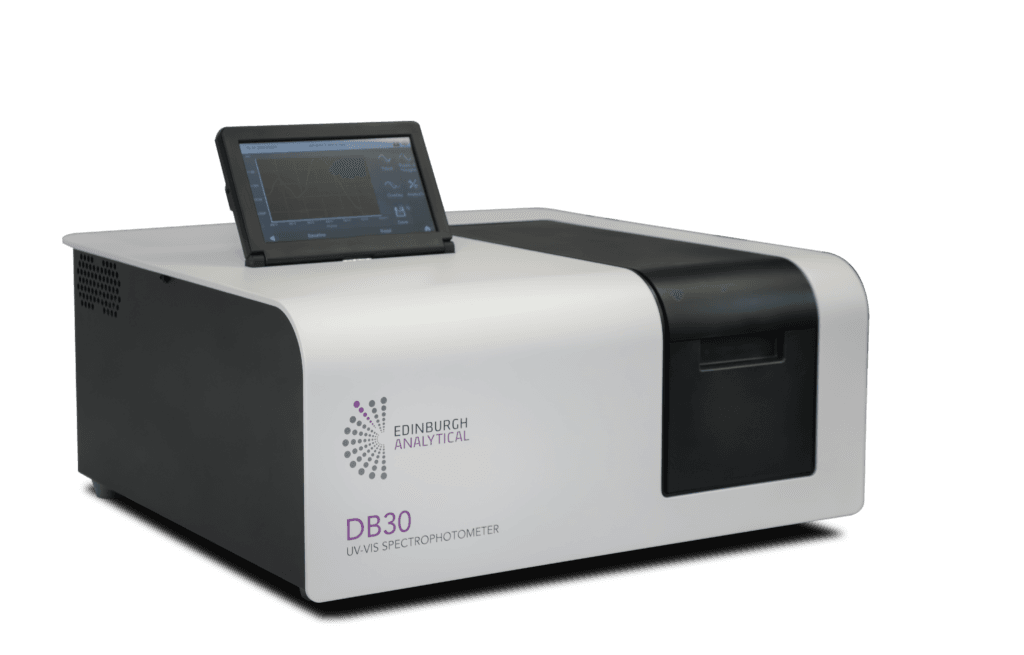
Figure 2. An Edinburgh Analytical DB30 UV-Vis Spectrophotometer.
Caffeine Stock Solution
A 1 mg/mL caffeine stock solution was prepared by dissolving 10 mg caffeine in 10 mL deionised water.
Tea Sample
1 g of black tea leaves were brewed in 32.5 mL boiling deionised water. Following filtration to remove tea leaves, the infusion was diluted 1:120 with deionised water.
Coffee Sample
3 g of Nescafé instant coffee was dissolved in 50 mL boiling water and diluted 1:120 with deionised water.
Coca-Cola Sample
Coca-Cola was diluted 1:50 using deionised water.
Celsius Energy Drink Sample
Celsius Kiwi Guava Lime energy drink was diluted 1:50 using deionised water.
Standard Solution Preparation
Five solutions were prepared for each beverage sample. Aliquots of 1 mL of diluted beverage were transferred into Falcon tubes and spiked with 0, 100, 200, 300 and 400 μL of the caffeine stock solution. The solutions were then diluted to a final volume of 10 mL using deionised water.
Measurements were performed using the Edinburgh Analytical DB30 UV-Vis Spectrophotometer. Full spectral scans were initially collected to identify the optimum analytical wavelength for caffeine determination. The DB30’s Quantitation feature was subsequently used to monitor absorbance at 270 nm and calculate caffeine concentrations using the standard-addition method. Data acquisition and analysis were performed using Spectracle software with the additional benefit of allowing the data to be seamlessly transferred to external Microsoft applications for further analysis.
The rapid scanning capability of the DB30 enabled the collection of full UV-Vis spectra for each spiked sample, allowing the caffeine absorption maximum to be readily identified. Figure 3 shows the UV-Vis absorption spectra of Celsius energy drink samples following the addition of increasing concentrations of the caffeine standard. As the concentration of added caffeine increased, a corresponding increase in absorbance was observed, particularly around 270 nm.
A pronounced absorbance feature was observed around 270 nm, corresponding to the characteristic absorption maximum of caffeine. Consequently, 270 nm was selected as the analytical wavelength for subsequent quantitative measurements.
The observed increase in absorbance demonstrates the suitability of UV-Vis spectroscopy for caffeine determination and forms the basis of the standard addition method used throughout this study. The same trend was observed across all beverage samples, with increasing additions of caffeine producing a corresponding increase in absorbance at 270 nm, enabling quantitative determination of caffeine content through standard-addition calibration.
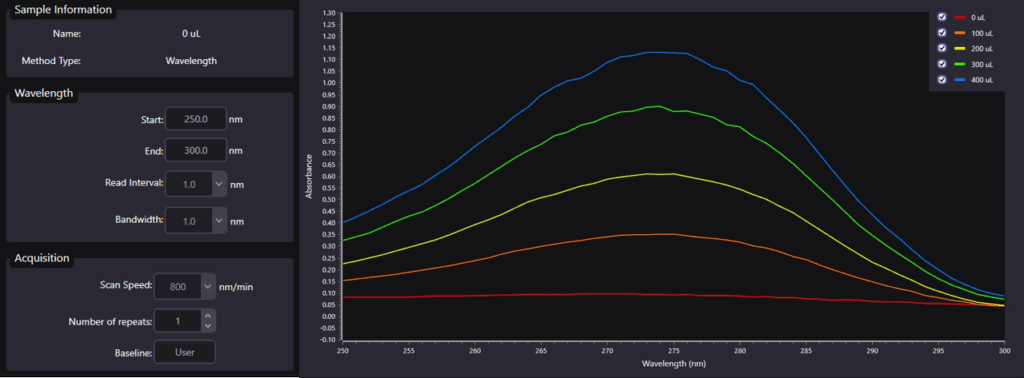
Figure 3. UV-Vis absorption spectra of caffeine-spiked Celsius energy drink samples showing increasing absorbance at approximately 270 nm, together with the acquisition parameters.
Using the Quantitation feature of the DB30, a standard-addition calibration was generated for each beverage sample. A representative example for the Celsius energy drink is shown in Figure 4. A linear response was observed across the concentration range investigated, enabling the caffeine concentration of the original sample to be determined. The same procedure was applied to all beverages analysed, and the resulting caffeine concentrations and recovery values are summarised in Table 1.
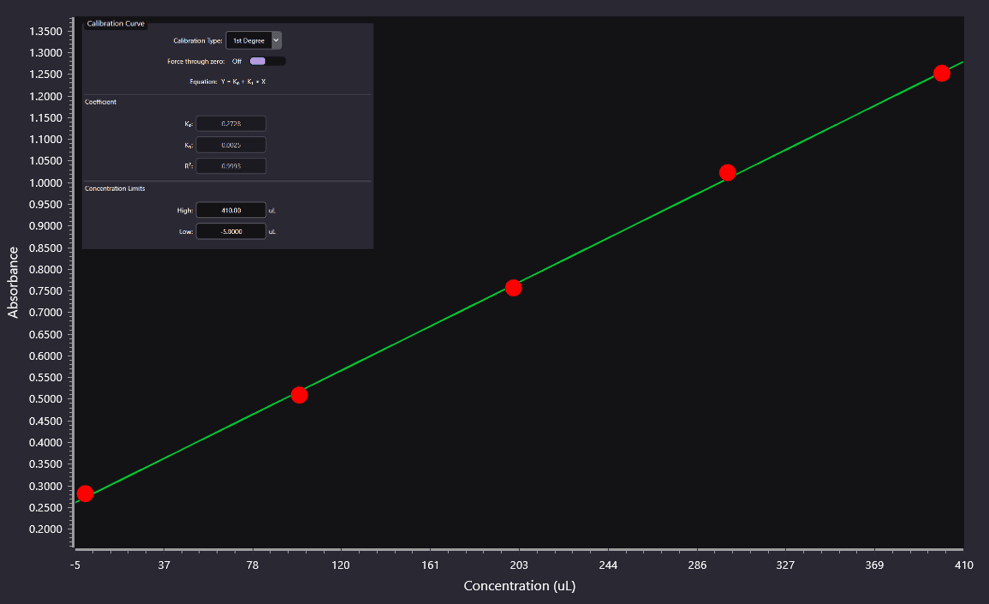
Figure 4. Standard-addition calibration generated using the DB30 Quantitation feature for determination of caffeine concentration in a Celsius energy drink sample.
The results demonstrate the capability of the DB30 UV-Vis Spectrophotometer to quantify caffeine in a range of beverage matrices using a consistent analytical workflow. Good agreement was observed between the calculated and typical reported caffeine concentrations for the tea, coffee and energy drink samples. Larger deviations were observed for Coca-Cola and decaffeinated coffee, highlighting the influence of matrix components that also absorb within the UV region. As UV-Vis spectroscopy measures the combined absorbance of all species present, overlapping spectral contributions may influence the calculated caffeine concentration in complex beverage formulations. Despite these challenges, the standard-addition approach helped to minimise matrix effects and enabled meaningful comparison of caffeine levels across the analysed beverages.4
Table 1. Calculated caffeine content in beverages determined using the DB30 UV-Vis Spectrophotometer and standard-addition calibration.5-9
| Beverage | Recommended Serving | Calculated Caffeine Concentration | Reported Caffeine Content | Spike Recovery (%) |
|---|---|---|---|---|
| Kiwi Guava and Lime Celsius | 335 mL | 183 mg | 200 mg | 93 |
| Black Tea | 240 mL | 72 mg | 40-70 mg | 85 |
| Nescafe Instant Coffee | 222 mL | 82 mg | 50-90 mg | 118 |
| Coca Cola | 330 mL | 218 mg | 33 mg | 65 |
| Nescafe Instant Decaf | 222 mL | 60 mg | 1-5 mg | 99 |
Recovery values obtained using the standard-addition approach further demonstrated the suitability of the method for caffeine analysis. The tea, coffee and Celsius samples gave recoveries ranging from 85-118%, indicating that the DB30 was able to reliably quantify changes in caffeine concentration following sample spiking.
UV-Vis spectroscopy provides a rapid and cost-effective approach for caffeine determination; however, unlike chromatographic techniques, it does not inherently separate caffeine from other UV-absorbing compounds present within a sample. Consequently, the measured absorbance at 270 nm may contain contributions from colourants, flavouring agents, preservatives, polyphenols and other naturally occurring beverage constituents.
The standard-addition approach employed in this study helps compensate for matrix-related signal enhancement or suppression and improves quantitative reliability. However, it cannot completely distinguish caffeine from co-absorbing species that exhibit similar UV absorption characteristics. As a result, samples containing significant levels of interfering compounds may yield higher apparent caffeine concentrations than expected.
The larger deviations observed for Coca-Cola and decaffeinated coffee illustrate this limitation. In these samples, matrix components absorbing near 270 nm are likely to have contributed to the measured signal, leading to overestimation of caffeine concentration.2 The particularly large discrepancy observed for Coca-Cola suggests substantial contributions from non-caffeine UV-absorbing species within the beverage matrix. Nevertheless, the linear response obtained following caffeine addition demonstrates the ability of the DB30 to reliably detect changes in analyte concentration within complex sample matrices.
For applications requiring maximum analyte specificity, chromatographic methods such as HPLC may provide improved selectivity. However, for routine screening, educational laboratories and rapid beverage analysis, the DB30 offers a simple and cost-effective alternative requiring minimal sample preparation.
The DB30 UV-Vis Spectrophotometer was successfully used to rapidly screen caffeine-containing beverages using a simple standard-addition workflow. Full spectral scanning enabled identification of the characteristic caffeine absorption maximum at approximately 270 nm, while integrated Quantitation functionality simplified calibration and concentration determination.
The method produced linear analytical responses across all samples and provided caffeine estimates that were consistent with expected values for tea, coffee and energy drink samples. Results obtained for Coca-Cola and decaffeinated coffee highlighted the influence of co-absorbing matrix components and demonstrated the limitations of single-wavelength UV-Vis analysis when applied to chemically complex beverages.
These findings show that the DB30 provides a rapid, low-cost and easy-to-use solution for beverage screening, educational laboratories and routine analytical investigations where minimal sample preparation and fast turnaround times are required.