A wine’s colour is one of its key characteristics that can be used to discern its age, quality and flavour profile. Colour intensity and hue are indicative of the expected body and phenolic content of wine. Wine is a complex mixture of chemical compounds; phenols such as anthocyanins and tannins play a crucial role in a wine’s pigment and mouthfeel.
A UV-Vis spectrophotometer offers many advantages in wine analysis, such as objectivity, reliability and rapid testing. It can be used for quality control and product consistency, as well as monitoring grape variety, fermentation and ageing.
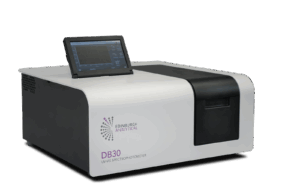
In this Application Note, an Edinburgh Analytical DB30 UV-Vis Spectrophotometer was used to analyse the colour and phenolic content of a variety of red, rosé and white wine samples (Figure 1).
Figure 1: An Edinburgh Analytical DB30 UV-Vis Spectrophotometer.
Intensity refers to the concentration of colour and correlates with a wine’s body and phenol levels. A higher intensity points to a more full-bodied wine with a higher phenolic content, whereas a lower intensity is characteristic of lighter-bodied and more delicate wines. The hue, or tonality, describes a specific colour which can indicate the wine’s age and style.
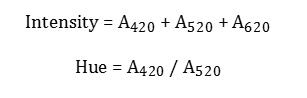
A quick method for determining a wine’s intensity and hue is to measure absorbance at 420, 520 and 620 nm, which correspond to the yellow, red and blue colourations of the wine, respectively. Results can be calculated and expressed according to the International Organisation of Vine and Wine (OIV) standard OIV-MA-AS2-07B (Chromatic characteristics, 2025).1
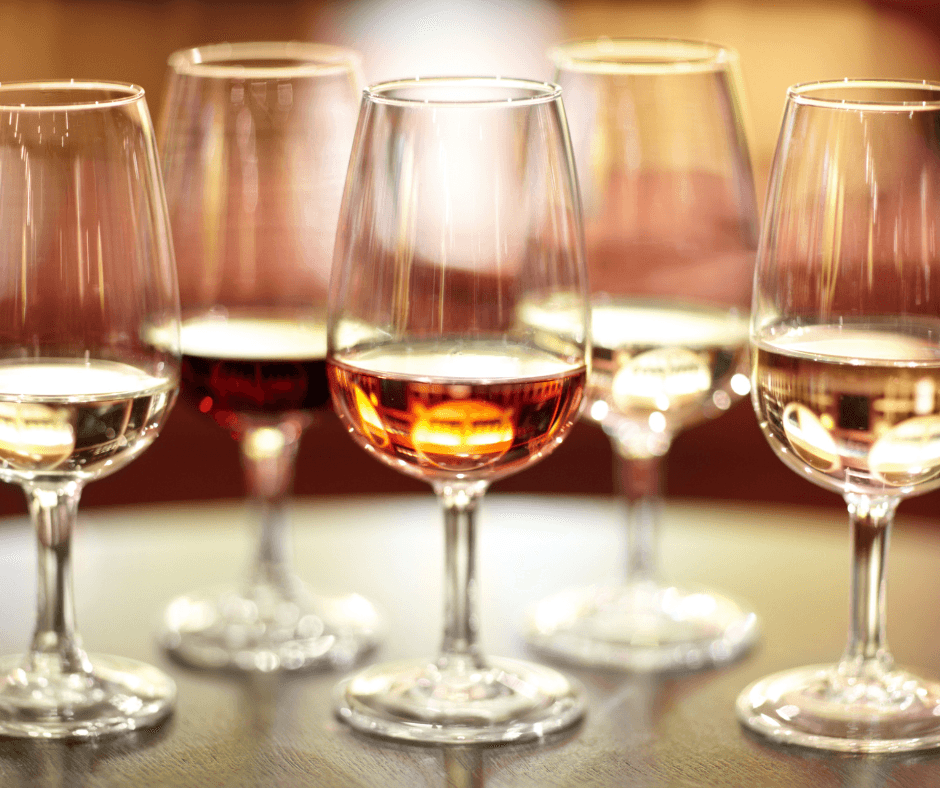
The three red wines were diluted 1:10 with deionised water. The rosé and white wines were analysed undiluted. Each sample was loaded into a 10 mm pathlength quartz cuvette, and deionised water was used as a reference (Table 1, Figure 2).
Table 1: Sample numbers for each type of wine.
| Sample Number | Wine Type |
|---|---|
| 1-1 | Merlot |
| 2-1 | Cabernet Sauvignon |
| 3-1 | Red Wine Blend |
| 4-1 | White Zinfandel |
| 5-1 | White Malbec |
| 6-1 | Pinot Grigio |
| 7-1 | Sauvignon Blanc |
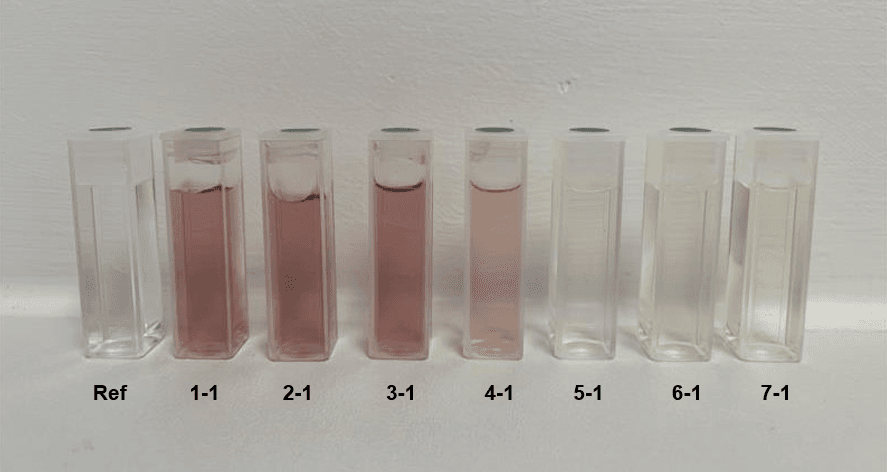
Figure 2: Samples of wine (Table 1) and deionised water (Ref) for colour analysis.
Measurements were performed on the DB30; the Photometry feature on the touchscreen interface was used to analyse the absorbance of the samples at discrete wavelengths of 420, 520 and 620 nm (Figure 3).
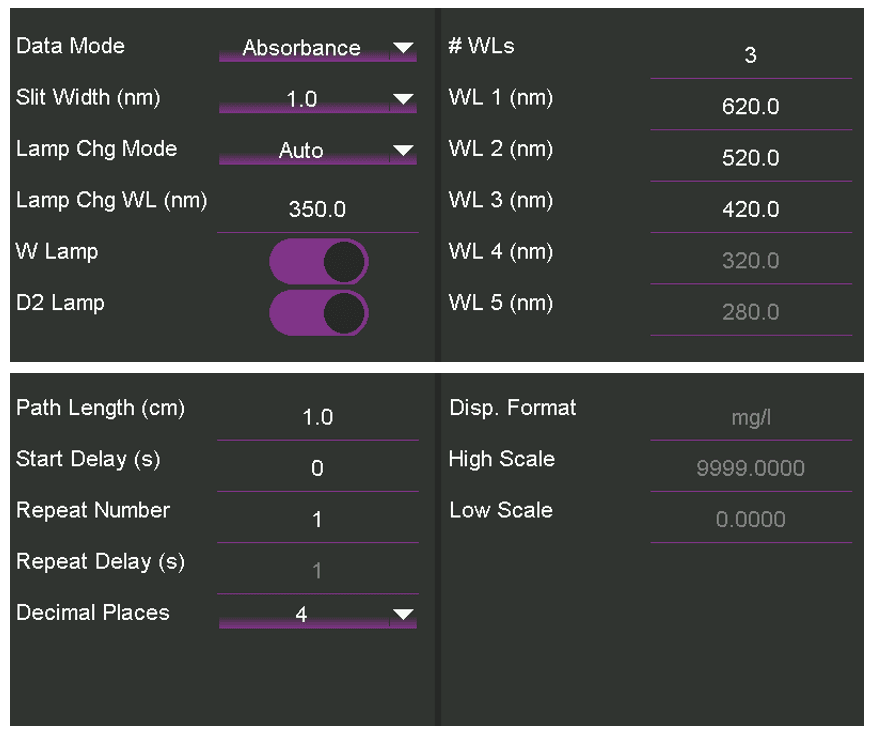
Figure 3: Experimental parameters for photometric analysis on the DB30 touchscreen interface.
The Photometry feature was used to analyse the wine samples at discrete wavelengths of 420, 520 and 620 nm (Table 2). The intensity and hue were calculated using the absorbance at these wavelengths, as defined in OIV-MA-AS2-07B.1
Where appropriate, absorbance values were corrected to account for the dilution factor. If using a cuvette of a different pathlength (e.g. 2 mm), these values would be divided by the length of the optical path in cm. The resulting values were expressed to three decimal places as indicated by OIV-MA-AS2-07B (Table 3).
Table 2: Absorbance values of wine samples at 420, 520 and 620 nm, taken from the DB30 touchscreen interface.
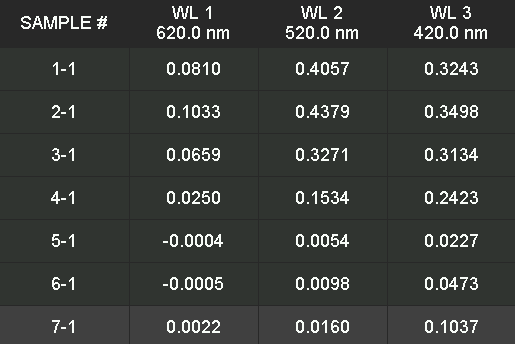
Table 3: Intensity and hue values of the wine samples.
| Sample Number | Wine | Intensity | Hue |
|---|---|---|---|
| 1-1 | Merlot | 8.110 | 0.799 |
| 2-1 | Cabernet Sauvignon | 8.910 | 0.799 |
| 3-1 | Red Wine Blend | 7.064 | 0.958 |
| 4-1 | White Zinfandel | 0.421 | 1.580 |
| 5-1 | White Malbec | 0.028 | 4.204 |
| 6-1 | Pinot Grigio | 0.057 | 4.827 |
| 7-1 | Sauvignon Blanc | 0.122 | 6.481 |
Intensity values were considerably higher for the three red wines, which was expected since red wine has a more concentrated colour and higher phenol levels than rosé and white wine. This can be attributed to a high absorbance at 520 nm, which corresponds to a high level of anthocyanins and is characteristic of red wine. Absorbance spectra of the wines were rapidly acquired (range 400—700 nm, slit width 1 nm, scan speed 1200 nm/min) to further visualise the differences in absorbance (Figure 4). The characteristic peak at 520 nm could be seen on the red and rose wine spectra.
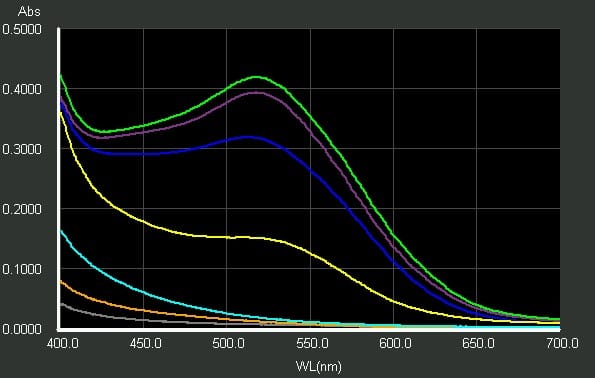
Figure 4: Absorbance spectra of the wine samples (1-1 purple, 2-1 green, 3-1 dark blue, 4-1 yellow, 5-1 grey, 6-1 orange, 7-1 turquoise).
The hue values provided a valuable insight into the appearance of the wine samples. They were lower for the red wines and rosé, which is expected due to the higher absorbance at 520 nm. A particularly high hue value can indicate increased ageing or oxidation in red wines, causing them to appear more brown in colour. For the white wine samples, the hue value increased from the White Malbec to the Sauvignon Blanc. These results agreed with the visual examination of the wines, with the White Malbec appearing palest of the three samples and therefore having the lowest hue, and the more deeply-coloured and full-bodied Sauvignon Blanc having the highest hue.
Phenolic compounds are bioactive molecules that affect the qualities of wine, such as colour, flavour and mouthfeel.2 These compounds are released from the solid parts of the grapes (skins and seeds) into the must during the winemaking process. Phenolic content is affected by the amount of time the must is in contact with the skins and seeds (i.e. the , and from the barrels or bottles during ageing.2 Phenolic compounds commonly found in wine include flavanols, anthocyanins, tannins and hydroxycinnamic acids. Red wines contain high levels of anthocyanins, flavanols and tannins due to prolonged skin contact period during the winemaking process.2 With white wines, the skin contact period is kept to a minimum, so they have a lower phenolic content compared to red wines. Hydroxycinnamic acids are the main phenolic compound in white wines due to their location in the grape’s flesh.2
UV-Vis spectrophotometry is a well-established method for identifying and quantifying phenolic compounds due to their biochemical and molecular properties. Phenolic substances contain phenolic rings, which strongly absorb UV light, and some of them provide information in the visible region due to their coloured nature (e.g. anthocyanins and flavanols). Absorbance at 280 nm is frequently used to determine total phenol count, due to the strong absorption by benzene rings at this wavelength. Hydroxycinnamic acids and anthocyanins also show a characteristic absorption band at 320 and 520 nm, respectively.
The DB30 can be used for rapid analysis of phenolic contents in wine using the Photometry feature of the spectrometer. Absorbances at 280, 320 and 520 nm were measured in order to identify and compare the presence of phenolic compounds in red, rose and white wines.
All wine samples were diluted 1:15 with deionised water and loaded into 10 mm pathlength quartz cuvettes (Figure 5). A deionised water sample was used as the reference.
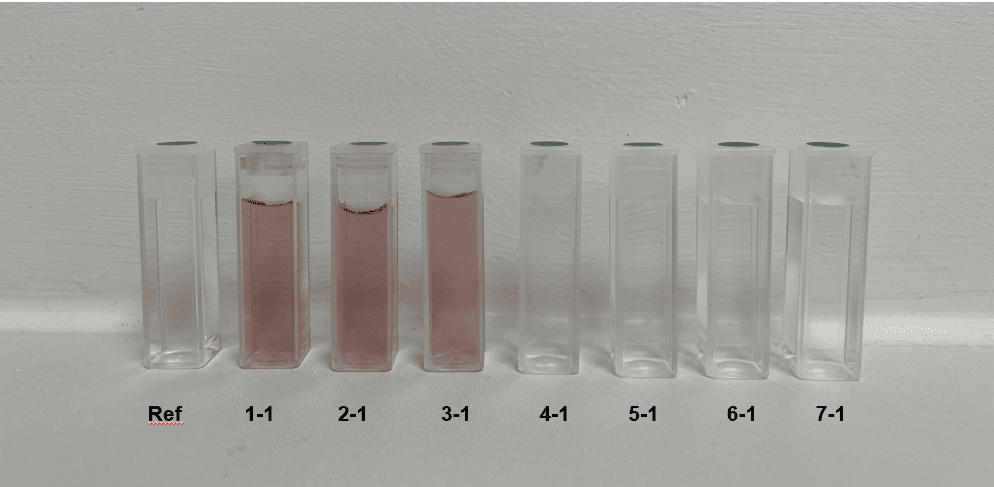
Figure 5: Samples of wine (Table 1) and deionised water (Ref) for phenolic analysis.
UV-Vis spectroscopic measurements were performed using the touchscreen interface to set up parameters. The same setup was used as for the colour analysis; however, the discrete wavelengths were set to 280, 320 and 520 nm.
The same procedure as that for the colour analysis was followed, this time detecting the absorbance at the three set wavelengths for phenolic detection (Step 3).
Absorbance measurements for the wine samples were acquired (Table 4) and corrected to account for the dilution factor (Table 5).
Table 4: Absorbance values of wine samples at 280, 320 and 520 nm, corrected to account for dilutions.
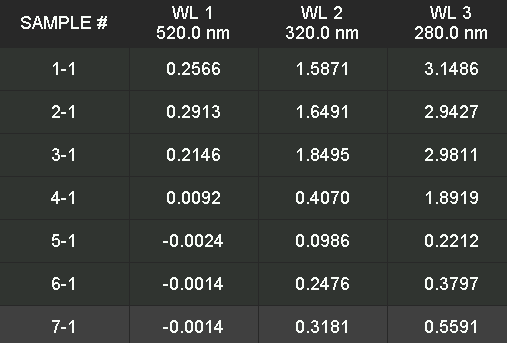
Table 5: Absorbance values of wine samples at 280, 320 and 520 nm, corrected to account for dilutions.
| Sample Number | Wine | Absorbance (corrected) | ||
|---|---|---|---|---|
| 280 nm | 320 nm | 520 nm | ||
| 1-1 | Merlot | 47.2290 | 23.8065 | 3.8490 |
| 2-1 | Cabernet Sauvignon | 44.1405 | 24.7365 | 4.3695 |
| 3-1 | Red Wine Blend | 44.7165 | 27.7425 | 3.2190 |
| 4-1 | White Zinfandel | 28.3785 | 6.1050 | 0.1380 |
| 5-1 | White Malbec | 3.3180 | 1.4790 | -0.0360 |
| 6-1 | Pinot Grigio | 5.6955 | 3.7140 | -0.0210 |
| 7-1 | Sauvignon Blanc | 8.3865 | 4.7715 | -0.0210 |
The red wines showed considerably higher absorbances at each wavelength compared to the rose and three white wines. This was expected as red wine has longer skin contact with the grapes during the winemaking process, which directly correlates to a higher phenol count. The red wines also showed their characteristic absorbance at 520 nm, associated with the presence of anthocyanins. The rosé wine (White Zinfandel) also showed a higher total phenol count (280 nm) than the three white wines, meaning it is richer in phenols. This was also anticipated since rose wines also have skin contact with the grape skins; however, it is for a shorter period of time compared to red wines. It can be noted that the rose has a higher absorbance at 320 nm than 520 nm, meaning it contains higher levels of hydroxycinnamic acids than anthocyanins. The three white wines showed the lowest concentration of phenolic compounds, and an expectedly low absorbance of anthocyanins at 520 nm. It was shown that the total phenol count (280 nm) increased from White Malbec to Sauvignon Blanc, which further aligns with visual analysis as the more golden Sauvignon Blanc was expected to have the highest phenolic count amidst the white wines.
This Application Note showcased that the Edinburgh Analytical DB30 UV-Vis Spectrophotometer provides a rapid and straightforward method for the analysis of wine. The Photometry feature of the DB30 can be used to analyse samples at discrete wavelengths to determine a wine’s hue and intensity, and phenolic content. The results acquired from the spectrophotometer agreed with the expected trends from visual analysis and literature. The DB30’s precision, high scan speed and touchscreen interface allow for rapid and user-friendly analysis, making the instrument invaluable in routine analysis and quality control during the winemaking and fermentation process.
References