Skip to content
Skip to content
  • Events
  • Blog
  • Events
  • Blog
Edinburgh Instruments
  • About Us
  • Products

    UV-Vis Spectrophotometers

    • DB30

    Fluorescence Spectrometer

    • FE30

    FTIR Spectrometers

    • IA30
    View All Products
  • Applications
  • Contact
  • About Us
  • All Products
    • DB30
    • FE30
    • IA30
  • Applications
  • Events
  • Blog
  • Distribution & Agents
  • Contact Us
Edinburgh Instruments

RESOURCES

Determining the Diameter of Quantum Dots Using a UV-Vis Spectrophotometer

  • August 19, 2025

KEY POINTS

  • Quantum dots (QDs) are semiconducting nanoparticles with unique optical and electrical properties.
  • The size-dependent tunability of QDs makes them useful in a wide range of applications such as photovoltaics, biomedical imaging and display technologies.
  • The DB30 UV-Vis Spectrophotometer can be used for simple, rapid, and reliable determination of the diameter of QDs, following ISO/TS 17466.
Edit Content

Quantum dots (QDs) are semiconducting nanoparticles with unique optical and electrical properties, intermediate between bulk materials and discrete molecules. These unique properties are partly due to the atypically high surface-to-volume ratio of QDs, meaning a large proportion of their atoms are located on the surface of the crystalline lattice. Additionally, the radii of QDs typically range from 2 to 10 nm, which results in pronounced quantum confinement effects.

These effects cause the electronic bands in QDs to split into discrete energy levels, and this change in energy levels affects the material’s properties. As the size of a QD decreases, the band gap increases (Figure 1), which causes a change in the wavelength of the emitted light, electrical conductivity, and optical properties of the QD. This size-dependent tunability makes QDs useful in a wide range of applications such as photovoltaics, biomedical imaging and display technologies.

Quantum dot size and energy band gap diagram, compared to bulk semiconductor.

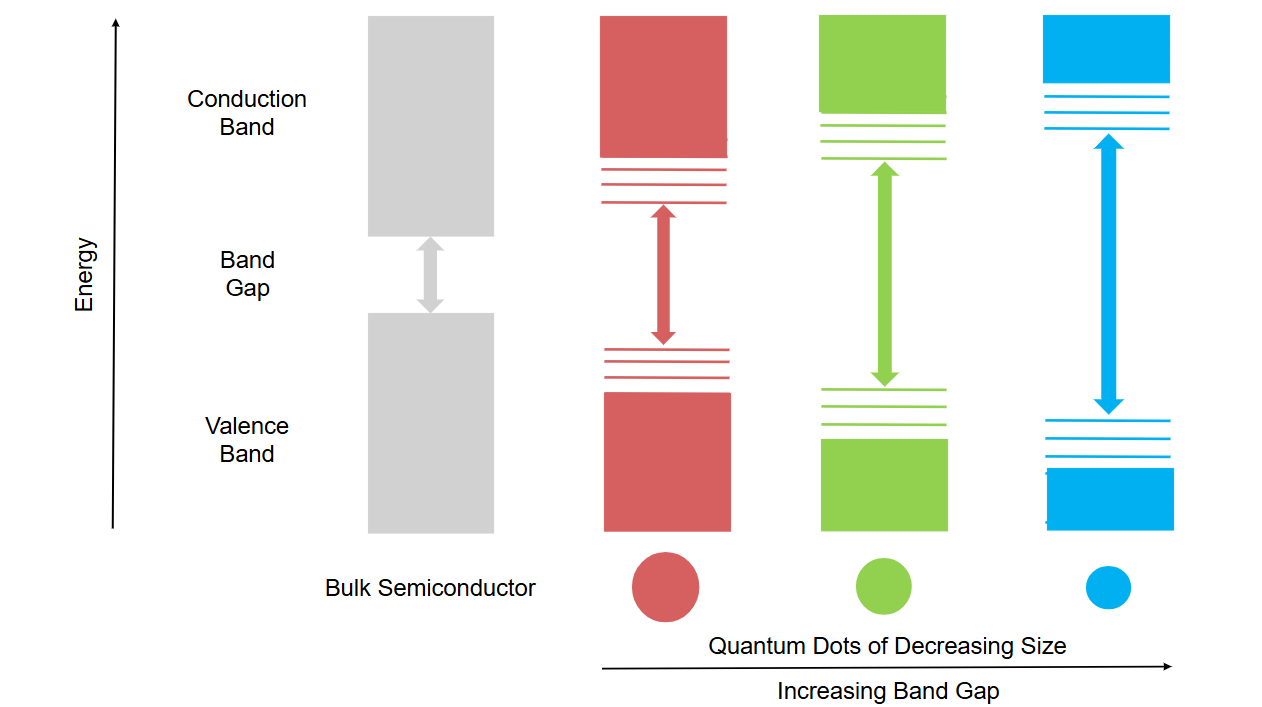
Figure 1: Band structure of a bulk semiconductor vs. QDs, and effects of QD size on band gap. Arrows represent the transition corresponding to the first excitonic absorption

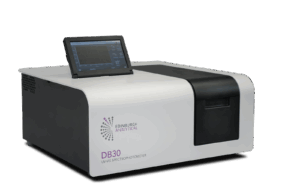
In this Application Note, an Edinburgh Analytical DB30 UV-Vis Spectrophotometer (Figure 2) is used in the characterisation of CdSe/ZnS QD samples in solution. By using the direct relationship between the first excitonic absorption peak and particle size, the diameter of QDs can be determined as defined in ISO/TS 17466 (Use of UV-Vis absorption spectroscopy in the characterization of cadmium chalcogenide colloidal quantum dots, 2015).1 The touchscreen interface, fast scanning rate, and double-beam approach of the DB30 allow for simple and rapid analysis of QDs.

Edinburgh Analytical DB30 UV-Vis Spectrophotometer

Figure 2: Edinburgh Analytical DB30 UV-Vis Spectrophotometer

Sample Preparation

Solutions of CdSe/ZnS QDs in toluene (Sigma Aldrich) were made to appropriate concentration (absorbance <1 at first excitonic absorption peak) and loaded into 10 mm pathlength quartz cuvettes. Toluene was used as the reference.


Instrument Configuration

UV-Vis spectroscopic measurements were performed on an Edinburgh Analytical DB30 UV-Vis Spectrophotometer, using the touchscreen interface to set up parameters (Figure 3). A narrow wavelength range was chosen to better identify the first excitonic absorption peak.

Experimental parameters on DB30 UV-Vis Spectrophotometer touchscreen interface

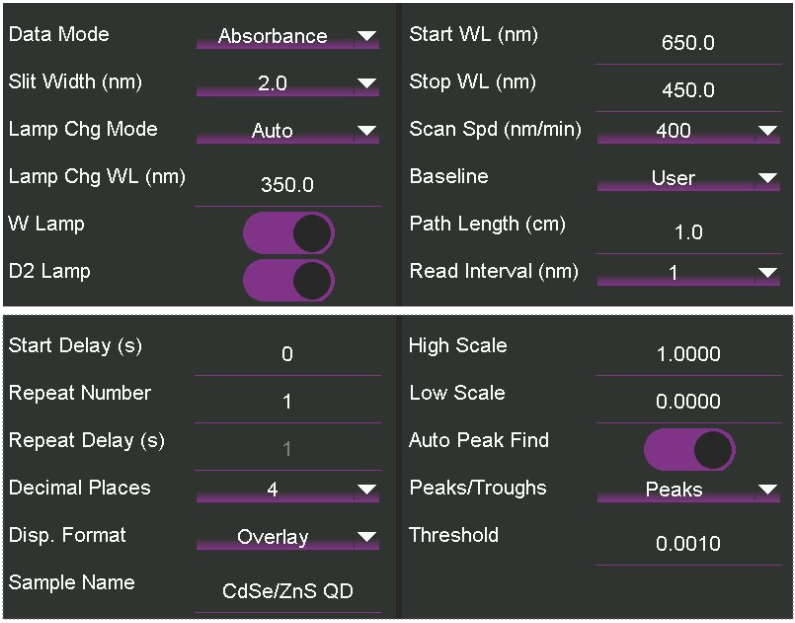
Figure 3: Experimental parameters on DB30 UV-Vis Spectrophotometer touchscreen interface


Procedure

  1. A baseline measurement was taken using an empty sample chamber.
  2. A cuvette containing the QD solution was inserted in the sample beam position, and the toluene reference cuvette was added to the reference beam position.
  3. A scan was run using the outlined parameters (Figure 3).
  4. The first excitonic absorption peak was located by identifying the longest wavelength local maximum in the absorption spectrum.
  5. That wavelength was used to calculate the diameter of the QDs in the sample, using an empirical sizing equation from ISO/TS 17466.1


Diameter of CdSe QDs from UV-Vis Absorption Spectra

The first excitonic absorption peak corresponds to the lowest energy optical transition between the discrete electronic states in the QD (Figure 1). Using DB30’s built-in Peaks and Troughs analysis, the peak for the prepared CdSe/ZnS solutions was found at λ = 526.0 nm (Figure 4). It was attributed to the excitonic transition from the ground state in the valence band to the first excitonic excited state in the conduction band.

UV-Vis absorption spectrum of CdSe QDs taken from the DB30 touchscreen interface. The Peaks and Troughs function determined the first excitonic absorption peak at 526.0 nm

Figure 4: UV-Vis absorption spectrum of CdSe QDs taken from the DB30 touchscreen interface. The Peaks and Troughs function determined the first excitonic absorption peak at 526.0 nm

The relationship between the diameter (D) of a QD and its first excitonic absorption peak is determined empirically by transmission electron microscopy (TEM) measurements, or X-ray diffraction (XRD) in the case of very small CdSe nanoclusters.2 In this case, the empirical sizing equation used was sourced from ISO/TS 17466, though some academic sources cite different coefficients dependent on possible errors within the TEM measurements.1, 3 The relationship formula according to ISO/TS 17466 is as follows:

It was determined that the diameter of the CdSe/ZnS QDs in the prepared solution was D = 2.64 nm. This demonstrated that UV-Vis absorption spectroscopy, carried out on the DB30 UV-Vis Spectrophotometer, provides a rapid method for estimating the diameter of QDs.

Conclusion

This Application Note demonstrated the use of the Edinburgh Analytical DB30 UV-Vis Spectrophotometer in a spectroscopic method for determining the diameter of CdSe/ZnS QDs. An easy method for the estimation of QD size is becoming increasingly important considering the growing number of applications of QDs in the biomedical and technological sectors. The DB30, with its user-friendly touchscreen interface and high scan speed, allows for fast and straightforward analysis and characterisation of QDs.

References

  1. ISO/TS 17466: Use of UV-Vis absorption spectroscopy in the characterization of cadmium chalcogenide colloidal quantum dots (2015).
  2. W. Yu et al., Chem. Mater., 2003, 15, 2854—2860.
  3. J. Jasieniak et al., J. Phys. Chem. C, 2009, 113, 19468–19474.

RELATED PRODUCTS

DB30

Double Beam UV-Vis Spectrophotometer

VIEW

Contact our expert team today to find out more about how our products can improve your research

Contact Us
PrevPrevious
NextNext

RESOURCES

Tags:
  • Application Notes
  • LEDs and Lighting
  • Photophysics
  • Photovoltaics
  • Quantum Dots
  • DB30
  • UV-Vis
Application Note
Download PDF
Featured Product:

DB30 UV-Vis Spectrophotometer

View more »
Share:

Keep up to date with the latest from Edinburgh Analytical

Join our mailing list and keep up with our latest videos, app notes and more!

LOCATION:
  • Edinburgh Instruments Ltd.
    2 Bain Square, Kirkton Campus, Livingston, EH54 7DQ.
  • sales@edinst.com
  • +44 1506 425 300
ABOUT:
  • About Us
  • Blog
  • Events
  • Distribution & Agents
  • Contact Us
  • About Us
  • Blog
  • Events
  • Distribution & Agents
  • Contact Us
PRODUCTS:
  • UV-Vis Spectrophotometers
  • Fluorescence Spectrometer
  • FTIR Spectrometers
  • All Products
  • UV-Vis Spectrophotometers
  • Fluorescence Spectrometer
  • FTIR Spectrometers
  • All Products
LEGALS:
  • Privacy Policy
  • Terms and Conditions
  • Privacy Policy
  • Terms and Conditions
SOCIALS:
Youtube Linkedin Instagram Facebook
©2024 Edinburgh Instruments. Registered in England and Wales No: 962331. VAT No: GB 271 7379 37
Manage Consent
To provide the best experiences, we use technologies like cookies to store and/or access device information. Consenting to these technologies will allow us to process data such as browsing behaviour or unique IDs on this site. Not consenting or withdrawing consent, may adversely affect certain features and functions.
Functional Always active
The technical storage or access is strictly necessary for the legitimate purpose of enabling the use of a specific service explicitly requested by the subscriber or user, or for the sole purpose of carrying out the transmission of a communication over an electronic communications network.
Preferences
The technical storage or access is necessary for the legitimate purpose of storing preferences that are not requested by the subscriber or user.
Statistics
The technical storage or access that is used exclusively for statistical purposes. The technical storage or access that is used exclusively for anonymous statistical purposes. Without a subpoena, voluntary compliance on the part of your Internet Service Provider, or additional records from a third party, information stored or retrieved for this purpose alone cannot usually be used to identify you.
Marketing
The technical storage or access is required to create user profiles to send advertising, or to track the user on a website or across several websites for similar marketing purposes.
Manage options Manage services Manage {vendor_count} vendors Read more about these purposes
View preferences
{title} {title} {title}