Extra virgin olive oil (EVOO) is one of the most highly valued edible oils due to its nutritional benefits, distinctive flavour profile, and abundance of bioactive compounds.1 Its premium market value, however, makes it particularly vulnerable to food fraud through adulteration with lower-cost vegetable oils such as sunflower oil.2 Reliable analytical methods that can rapidly assess oil authenticity are therefore essential for food manufacturers, quality control laboratories, and regulatory agencies.
Fluorescence spectroscopy provides a simple, rapid, and non-destructive method for characterising edible oils. Many oils contain naturally fluorescent compounds including chlorophylls, pheophytins, tocopherols, phenolic compounds, and oxidation products.3,4 These compounds generate characteristic fluorescence signatures that can be used to distinguish different oil types and identify compositional changes resulting from adulteration.
Excitation-emission matrix (EEM) fluorescence spectroscopy expands on conventional fluorescence measurements by collecting fluorescence intensity across a broad range of excitation and emission wavelengths. The resulting EEM dataset provides a comprehensive fluorescence fingerprint that can reveal subtle differences in chemical composition and enhance sample discrimination.3,5
In this Application Note, EEM fluorescence spectroscopy was used to generate fluorescence fingerprints of several edible oils and investigate the adulteration of EVOO with sunflower oil. Measurements were performed using the Edinburgh Analytical FE30 Fluorescence Spectrometer, demonstrating the effectiveness of fluorescence fingerprinting as a rapid tool for edible oil authentication.
Oil samples were analysed directly without dilution. Approximately 200 µL of each sample was transferred into a 3 mm × 3 mm optical plastic microcuvette (VersaFluor™ Microcuvettes) prior to analysis.
For the adulteration study, mixtures containing varying proportions of EVOO and sunflower oil were prepared. Known volumes of each oil were combined to generate samples across the full composition range, from pure EVOO to pure sunflower oil. Following preparation, each sample was transferred directly into an optical microcuvette for fluorescence analysis.
Fluorescence measurements were performed using the FE30 Fluorescence Spectrometer (Figure 1). EEM spectra were acquired for each sample to generate fluorescence fingerprints.
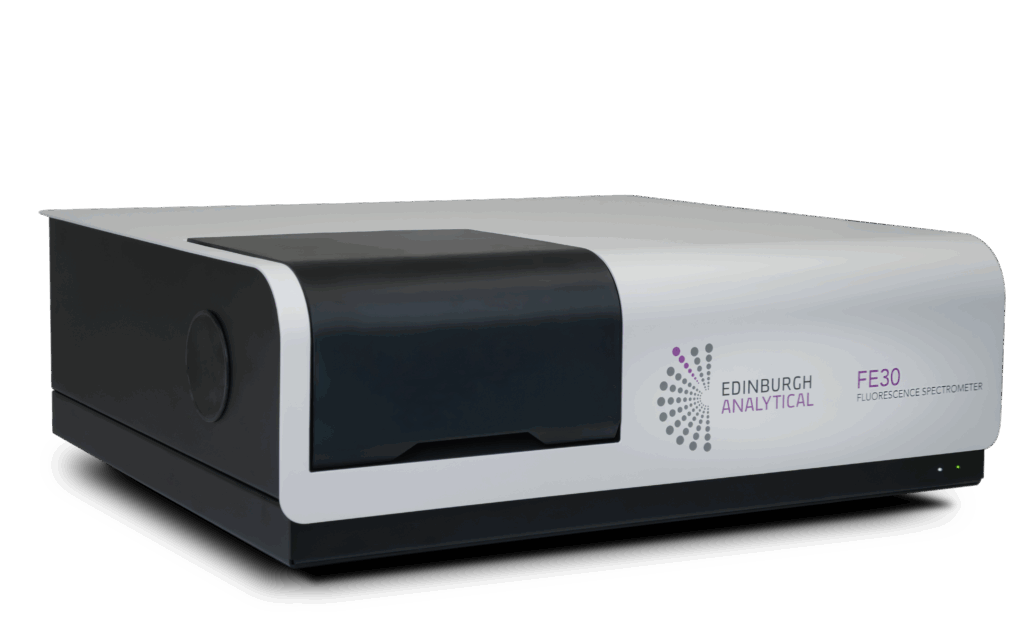
Figure 1. An Edinburgh Analytical FE30 Fluorescence Spectrometer.
EEM spectroscopy records fluorescence intensity across multiple excitation and emission wavelength combinations, providing detailed information about the fluorescent species present within a sample. This approach enables visualisation of the complete fluorescence landscape and facilitates differentiation between chemically similar materials. The parameters used to acquire the spectra are outlined in Table 1.
Table 1. Measurement parameters used for EEM fluorescence analysis on the FE30 Fluorescence Spectrometer.
| Parameter | Value |
|---|---|
| Excitation Wavelength Range | 250 - 800 nm |
| Excitation Bandwidth | 5 nm |
| Excitation Read Interval | 1 nm |
| Emission Wavelength Range | 250 - 800 nm |
| Emission Bandwidth | 1 nm |
| Emission Read Interval | 5 nm |
| Scan Speed | 60,000 nm/min |
| PMT Voltage | 800 V |
Initially, fluorescence fingerprints were collected for a range of edible oils to assess their characteristic spectral features. EEM measurements were subsequently performed on the EVOO adulteration series to investigate the effect of increasing sunflower oil concentration on the fluorescence profile.
EEM fluorescence fingerprints were collected for sunflower oil, rapeseed oil, sesame oil, and EVOO (Figure 2a-d). Each sample produced a distinct fluorescence profile reflecting differences in chemical composition.
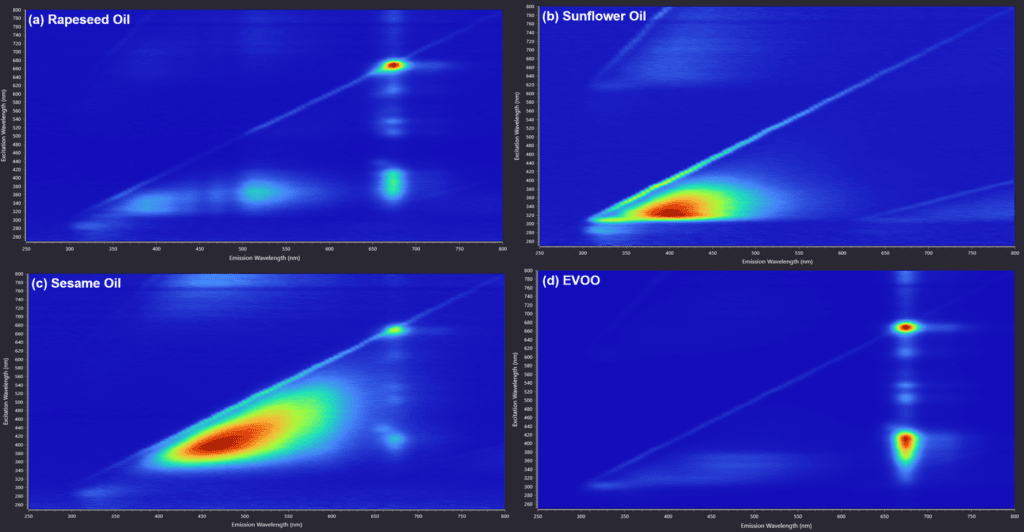
Figure 2. EEM fluorescence fingerprints of edible oils: (a) Rapeseed oil; (b) Sunflower oil; (c) Sesame oil; (d) EVOO.
The edible oils exhibited fluorescence features within the 300-500 nm emission region, commonly associated with naturally occurring compounds such as tocopherols (vitamin E), phenolic compounds, and lipid oxidation products.3 Differences in the intensity and distribution of these features contributed to the unique fluorescence fingerprints observed for each oil.
EVOO and rapeseed oil displayed strong fluorescence bands between approximately 650 and 700 nm.3 This region is commonly attributed to chlorophyll and pheophytin pigments and provides a valuable marker for differentiating oils derived from plant materials. The presence and relative intensity of these fluorescence features enabled clear discrimination between the oils examined.
In contrast, sunflower oil and sesame oil exhibited substantially weaker fluorescence within the chlorophyll-associated emission region, resulting in spectral fingerprints that were readily distinguishable from EVOO.
The ability to obtain distinctive fluorescence fingerprints without extensive sample preparation highlights the value of EEM fluorescence spectroscopy as a rapid screening technique for edible oil authentication and quality assessment.
To evaluate the ability of EEM fluorescence spectroscopy to detect food fraud, a series of EVOO samples containing increasing concentrations of sunflower oil was prepared and analysed (Figure 3a-e).
The resulting fluorescence fingerprints revealed systematic changes across the adulteration series. As the concentration of sunflower oil increased, fluorescence features characteristic of EVOO progressively decreased, while fluorescence contributions associated with sunflower oil became more prominent.
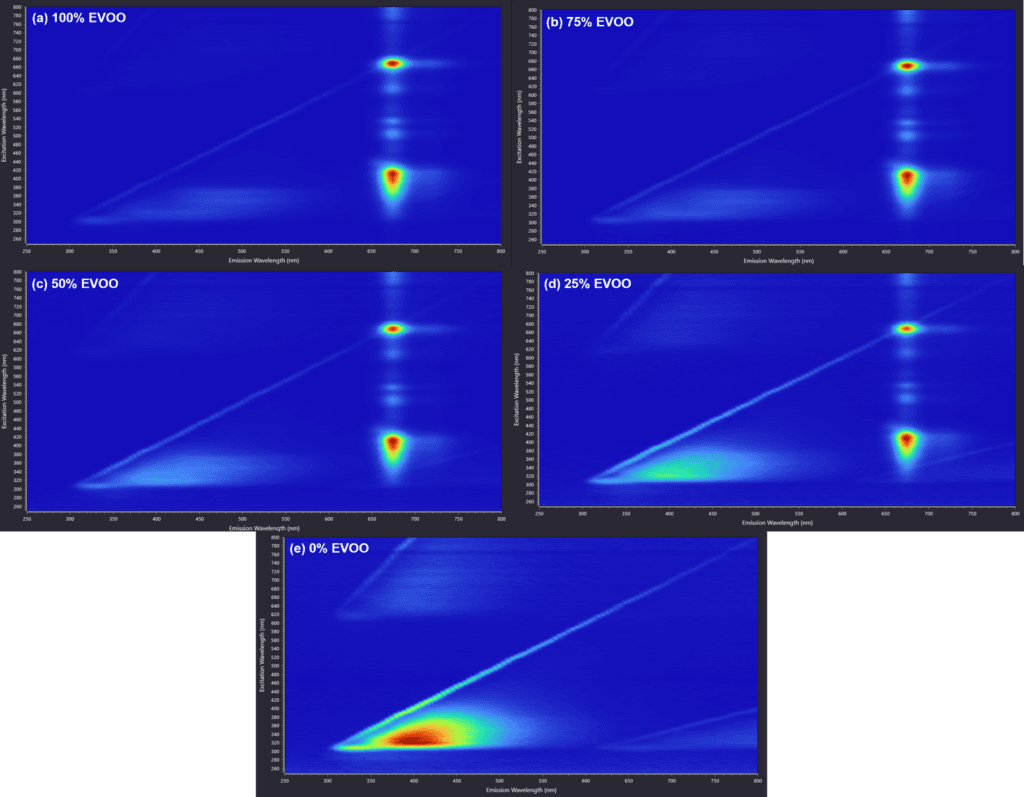
Figure 3. EEM fluorescence fingerprints obtained from EVOO adulterated with increasing proportions of sunflower oil: (a) 100% EVOO; (b) 75% EVOO; (c) 50% EVOO; (d) 25% EVOO; (e) 0% EVOO.
A gradual transition between the fluorescence fingerprint of pure EVOO and pure sunflower oil was clearly visible within the EEM contour maps, demonstrating the sensitivity of fluorescence spectroscopy to changes in oil composition.
The most significant spectral variation occurred within the 650-700 nm emission region, where EVOO exhibited a strong fluorescence feature centred at approximately 675 nm. This emission is associated with chlorophyll-derived compounds naturally present in olive oil. As sunflower oil was added, the intensity of this feature decreased steadily due to dilution of the fluorescent species responsible for the signal.
Additional changes were observed within the 300-500 nm emission region, reflecting differences in the concentrations of tocopherols and other naturally fluorescent compounds present within the oils. Together, these variations produced measurable changes in the overall fluorescence fingerprint and provided multiple indicators of sample composition.
The reproducible nature of these spectral changes demonstrates the potential of EEM fluorescence spectroscopy as a rapid and non-destructive method for detecting EVOO adulteration.
To investigate the potential for quantitative analysis, the fluorescence intensity of the chlorophyll-associated fluorescence feature centred at approximately 675 nm was monitored across the adulteration series.
As the concentration of sunflower oil increased, the fluorescence intensity decreased in a predictable manner. This behaviour is consistent with dilution of the chlorophyll-containing compounds present in EVOO and produced a clear calibration trend across the prepared mixtures.
The strong correlation between fluorescence intensity and EVOO concentration demonstrates that EEM fluorescence spectroscopy can be used not only for qualitative identification but also for quantitative determination of adulteration levels.5,6
Figure 4 shows the calibration curve obtained from the fluorescence intensity measured at the characteristic 675 nm emission feature (at 413 nm excitation).
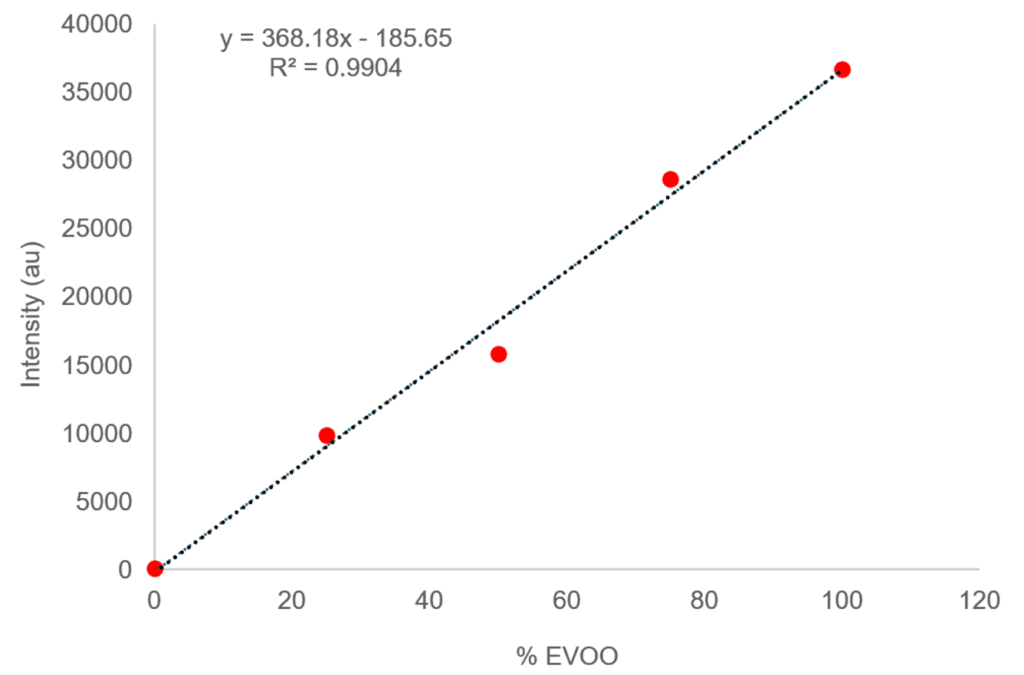
Figure 4. Calibration curve showing the variation of chlorophyll-associated fluorescence intensity with EVOO concentration.
To demonstrate practical implementation of the calibration model, an unknown oil sample was analysed under identical experimental conditions. The fluorescence intensity measured at the selected chlorophyll emission peak was 31,969 au.
Calibration of the chlorophyll-associated fluorescence feature yielded the following linear relationship:
 , where
Substituting the measured fluorescence intensity into the calibration equation:

Rearranging to solve for:

The unknown sample was therefore determined to contain approximately 87.3% EVOO.
Assuming the remaining composition consists of sunflower oil, the sample contains approximately 12.7% sunflower oil adulteration. The sample contained ~10 % sunflower oil adulteration – which matches well with the predicted value.
This example demonstrates how fluorescence measurements obtained using the FE30 can be translated directly into compositional information, providing a straightforward method for authenticity assessment and adulteration quantification without extensive sample preparation or complex analytical workflows.
The FE30 Fluorescence Spectrometer combines high sensitivity, rapid spectral acquisition, and a broad wavelength range to enable comprehensive fluorescence fingerprinting studies. The instrument is ideally suited to EEM measurements, providing detailed spectral information that can be used to distinguish authentic and adulterated food products.
The ability to acquire high-quality EEM datasets with minimal sample preparation makes the FE30 particularly attractive for routine quality control and authenticity testing applications. Combined with simple data interpretation and quantitative analysis capabilities, the FE30 provides an efficient analytical solution for food fraud investigations and edible oil authentication.
EEM fluorescence spectroscopy provides a rapid, sensitive, and non-destructive approach for edible oil authentication and adulteration detection. Distinct fluorescence fingerprints were obtained for a range of edible oils, allowing clear differentiation based on their naturally occurring fluorescent constituents.
Adulteration of EVOO with sunflower oil produced systematic and measurable changes in fluorescence intensity and spectral distribution, particularly within the chlorophyll-associated emission region centred at approximately 675 nm. These changes enabled both visual identification of adulterated samples and quantitative estimation of EVOO content through calibration-based analysis.
Analysis of an unknown sample demonstrated the ability of the technique to determine oil composition directly from fluorescence measurements, yielding an estimated EVOO content of 87.3%. The combination of rapid analysis, minimal sample preparation, and excellent sensitivity to compositional change highlights the potential of the FE30 Fluorescence Spectrometer as a powerful tool for routine food authenticity testing, quality assurance, and food fraud detection.