Accurate quantification of active pharmaceutical compounds (APIs) is essential to ensure product quality, patient safety and therapeutic effectiveness, particularly when products contain APIs at low concentrations.¹ Reliable analytical methods are therefore required to provide precise and accurate measurements throughout pharmaceutical development and quality control processes. Fluorescence spectroscopy is widely recognised as one of the most sensitive spectroscopic techniques available and offers several advantages, including high selectivity, rapid analysis and low detection limits.² These characteristics make it particularly suitable for the determination of trace-level compounds in complex sample matrices.
Duloxetine hydrochloride is an API which acts as a serotonin-norepinephrine reuptake inhibitor. It is commonly prescribed for the treatment of major depressive disorder, generalised anxiety disorder and certain chronic pain conditions.3
In this Application Note, duloxetine hydrochloride (Figure 1) was analysed using the Edinburgh Analytical FE30 Fluorescence Spectrometer to investigate its fluorescent properties and assess the suitability of the technique for quantitative analysis. The analytical performance of the method was evaluated through the construction of a calibration curve and determination of key validation parameters, including the limit of detection (LOD) and limit of quantitation (LOQ). These parameters provide an indication of the sensitivity and reliability of the analytical method and are commonly used to assess fitness for purpose in accordance with current analytical validation guidelines.¹
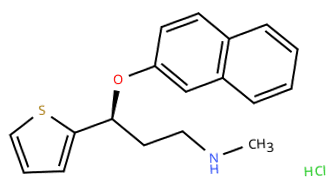
Figure 1. Molecular structure of duloxetine hydrochloride.
Duloxetine hydrochloride standards were prepared at concentrations of 0.02, 0.05, 0.1, 0.2, 0.4 and 0.8 µg/mL in methanol. Samples were transferred to 10 mm fluorescence cuvettes and analysed directly.
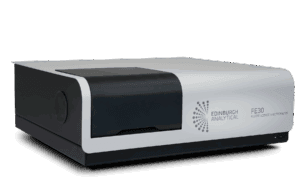
Analysis was performed using an Edinburgh Analytical FE30 Fluorescence Spectrometer (Figure 2). The instrument was used to acquire fluorescence emission spectra and background measurements were subtracted from samples prior to analysis.
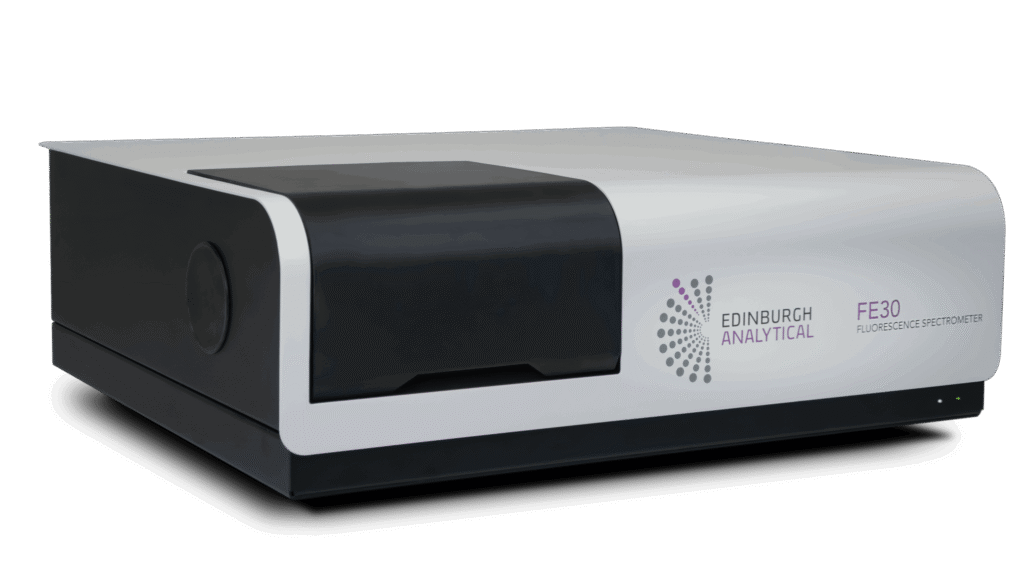
Figure 2. Edinburgh Analytical FE30 Fluorescence Spectrometer.
Fluorescence emission spectra were acquired for a series of duloxetine hydrochloride standards over the concentration range 0.02-0.80 µg /mL alongside a methanol blank measured under identical experimental conditions (Figure 3). The blank spectrum was used to account for background fluorescence arising from the solvent and instrument response.4 Based on preliminary measurements, an excitation wavelength of 290 nm was selected for all subsequent analyses as this corresponded to the excitation maximum of duloxetine hydrochloride in methanol.
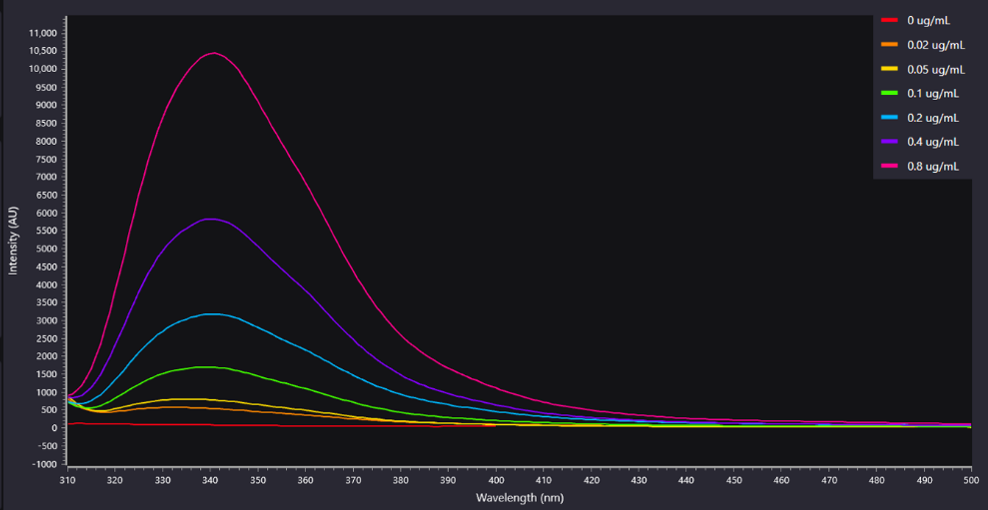
Figure 3. Fluorescence spectra of duloxetine hydrochloride at varying concentrations.
Following data acquisition, the methanol blank spectrum was subtracted from each duloxetine hydrochloride spectrum using the internal calculator function within the Spectracle software package (Figure 4). This background correction produced clean fluorescence spectra attributable solely to duloxetine hydrochloride, enabling accurate comparison of fluorescence intensity across the concentration range investigated.
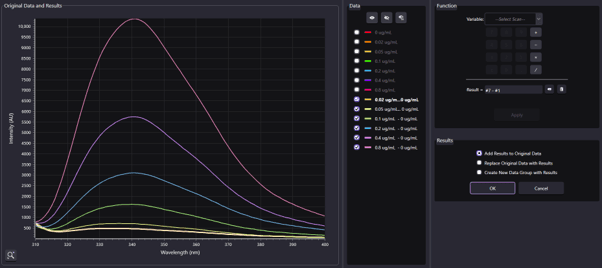
Figure 4. Subtracted fluorescence spectra of duloxetine hydrochloride at varying concentrations.
Following background subtraction, all concentrations exhibited a fluorescence emission maximum at approximately 340 nm. The fluorescence intensity at this wavelength was extracted from each spectrum and plotted against concentration to generate a calibration curve.
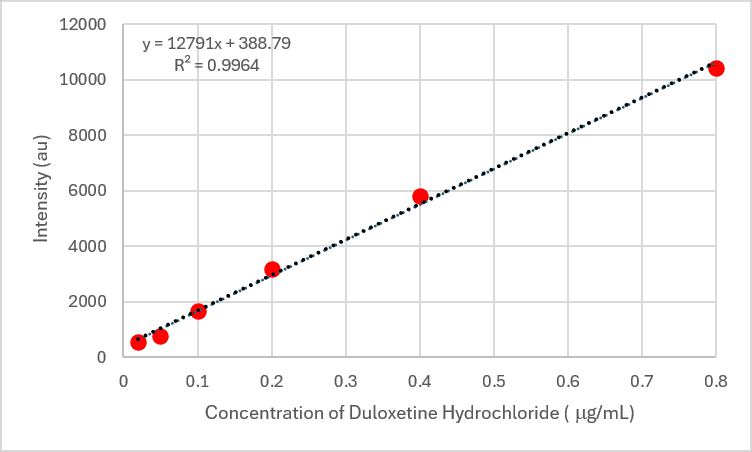
Figure 5. Calibration curve generated from the fluorescence intensity measured at 340 nm for duloxetine hydrochloride standards.
Linear regression of the calibration data produced the following relationship:

where y is the fluorescence intensity at 340 nm and x is the duloxetine hydrochloride concentration (µg/mL). The calibration curve exhibited excellent linearity (R² = 0.996), indicating a strong proportional relationship between fluorescence intensity and Duloxetine Hydrochloride concentration over the investigated range. This demonstrates that fluorescence intensity can be reliably used for quantitative determination of the analyte. The small negative intercept suggests a minimal systematic offset in the instrument response, although its magnitude is negligible relative to the fluorescence signals measured across the calibration range.
To evaluate method sensitivity, the methanol blank was measured 20 times under identical experimental conditions. The standard deviation of the blank response (σ) was calculated to be 1.86 au and used to determine the LOD and LOQ.

where is an individual blank measurement, is the mean blank response and is the number of blank measurements.
The LOD and LOQ were subsequently calculated using the standard deviation of the blank and the slope of the calibration curve according to1:

where σ is the standard deviation of the blank measurements and m is the slope of the calibration curve (Table 1).
Table 1. Analytical performance parameters for the determination of duloxetine hydrochloride.
| Parameter | Value |
|---|---|
| Calibration Range | 0.02-0.80 µg/mL |
| Slope | 12 791 |
| R² | 0.996 |
| Blank standard deviation (σ) | 1.86 au |
| LOD | 0.00048 µg/mL (0.48 ppb) |
| LOQ | 0.00145 µg/mL (1.45 ppb) |
Fluorescence spectroscopy was successfully applied to the quantitative determination of duloxetine hydrochloride in methanol. Following background correction using a methanol blank, the analyte exhibited a well-defined fluorescence emission maximum at 340 nm, enabling reliable quantification across the concentration range of 0.02-0.80 µg/mL.
Method sensitivity was evaluated through determination of the LOD and LOQ, which were found to be 0.00048 µg/mL and 0.00145 µg/mL, respectively. These low values indicate that the method can detect and quantify Duloxetine Hydrochloride at trace levels, highlighting one of the principal advantages of fluorescence spectroscopy over less sensitive spectroscopic techniques.
Overall, the results demonstrate that fluorescence spectroscopy provides a simple, rapid and reliable approach for the determination of duloxetine hydrochloride at low concentrations. The excellent linearity, combined with low ppb detection capability, suggests that the method has potential utility for pharmaceutical analysis, quality control applications and studies requiring the measurement of trace quantities of the drug.