Chromophoric dissolved organic matter (CDOM) is a significant component of the dissolved organic carbon pool in seawater. It primarily consists of substances such as humic acids, fulvic acids, and aromatic polymers. CDOM absorbs ultraviolet and visible light, subsequently emitting fluorescence at wavelengths longer than that of the absorbed light (Figure 1). Together with phytoplankton and suspended sediments, CDOM constitutes the three major factors influencing the colour of the water, making it an essential element in ocean colour remote sensing.
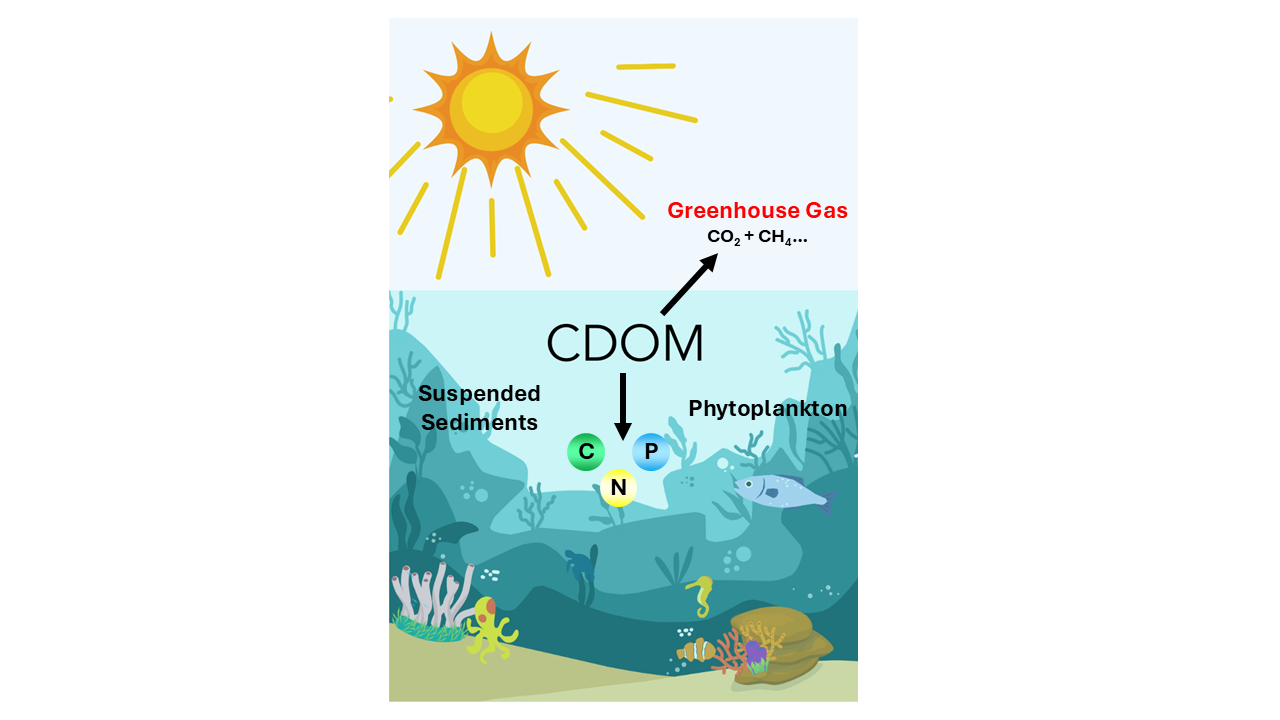
Figure 1. Chromophoric dissolved organic matter (CDOM) in marine water sources.
Chromophoric dissolved organic matter plays a direct role in biogeochemical processes within the ocean and has a considerable regulatory effect on the global carbon cycle and climate change. Therefore, studying CDOM in seawater is of great significance. In recent years, the sources, migration, and fate of CDOM have become major research focuses worldwide. Furthermore, the absorption and fluorescence properties of CDOM are increasingly used as indicators of changes in water quality.
The detection of the fluorescence spectrum of chromophoric dissolved organic matter (CDOM) is primarily based on its fluorescent characteristics, allowing for qualitative and quantitative analysis through spectral information. Due to the complex structure and diverse origins of CDOM, traditional fluorescence spectroscopy often fails to capture all relevant information from the samples. In this Application Note we show how fluorescence spectroscopy can be used to monitor the quality of marine water.
A sample of marine water using an Edinburgh Analytical FE30 Fluorescence Spectrometer. Spectracle software was used to collect ExEm maps of the sample.
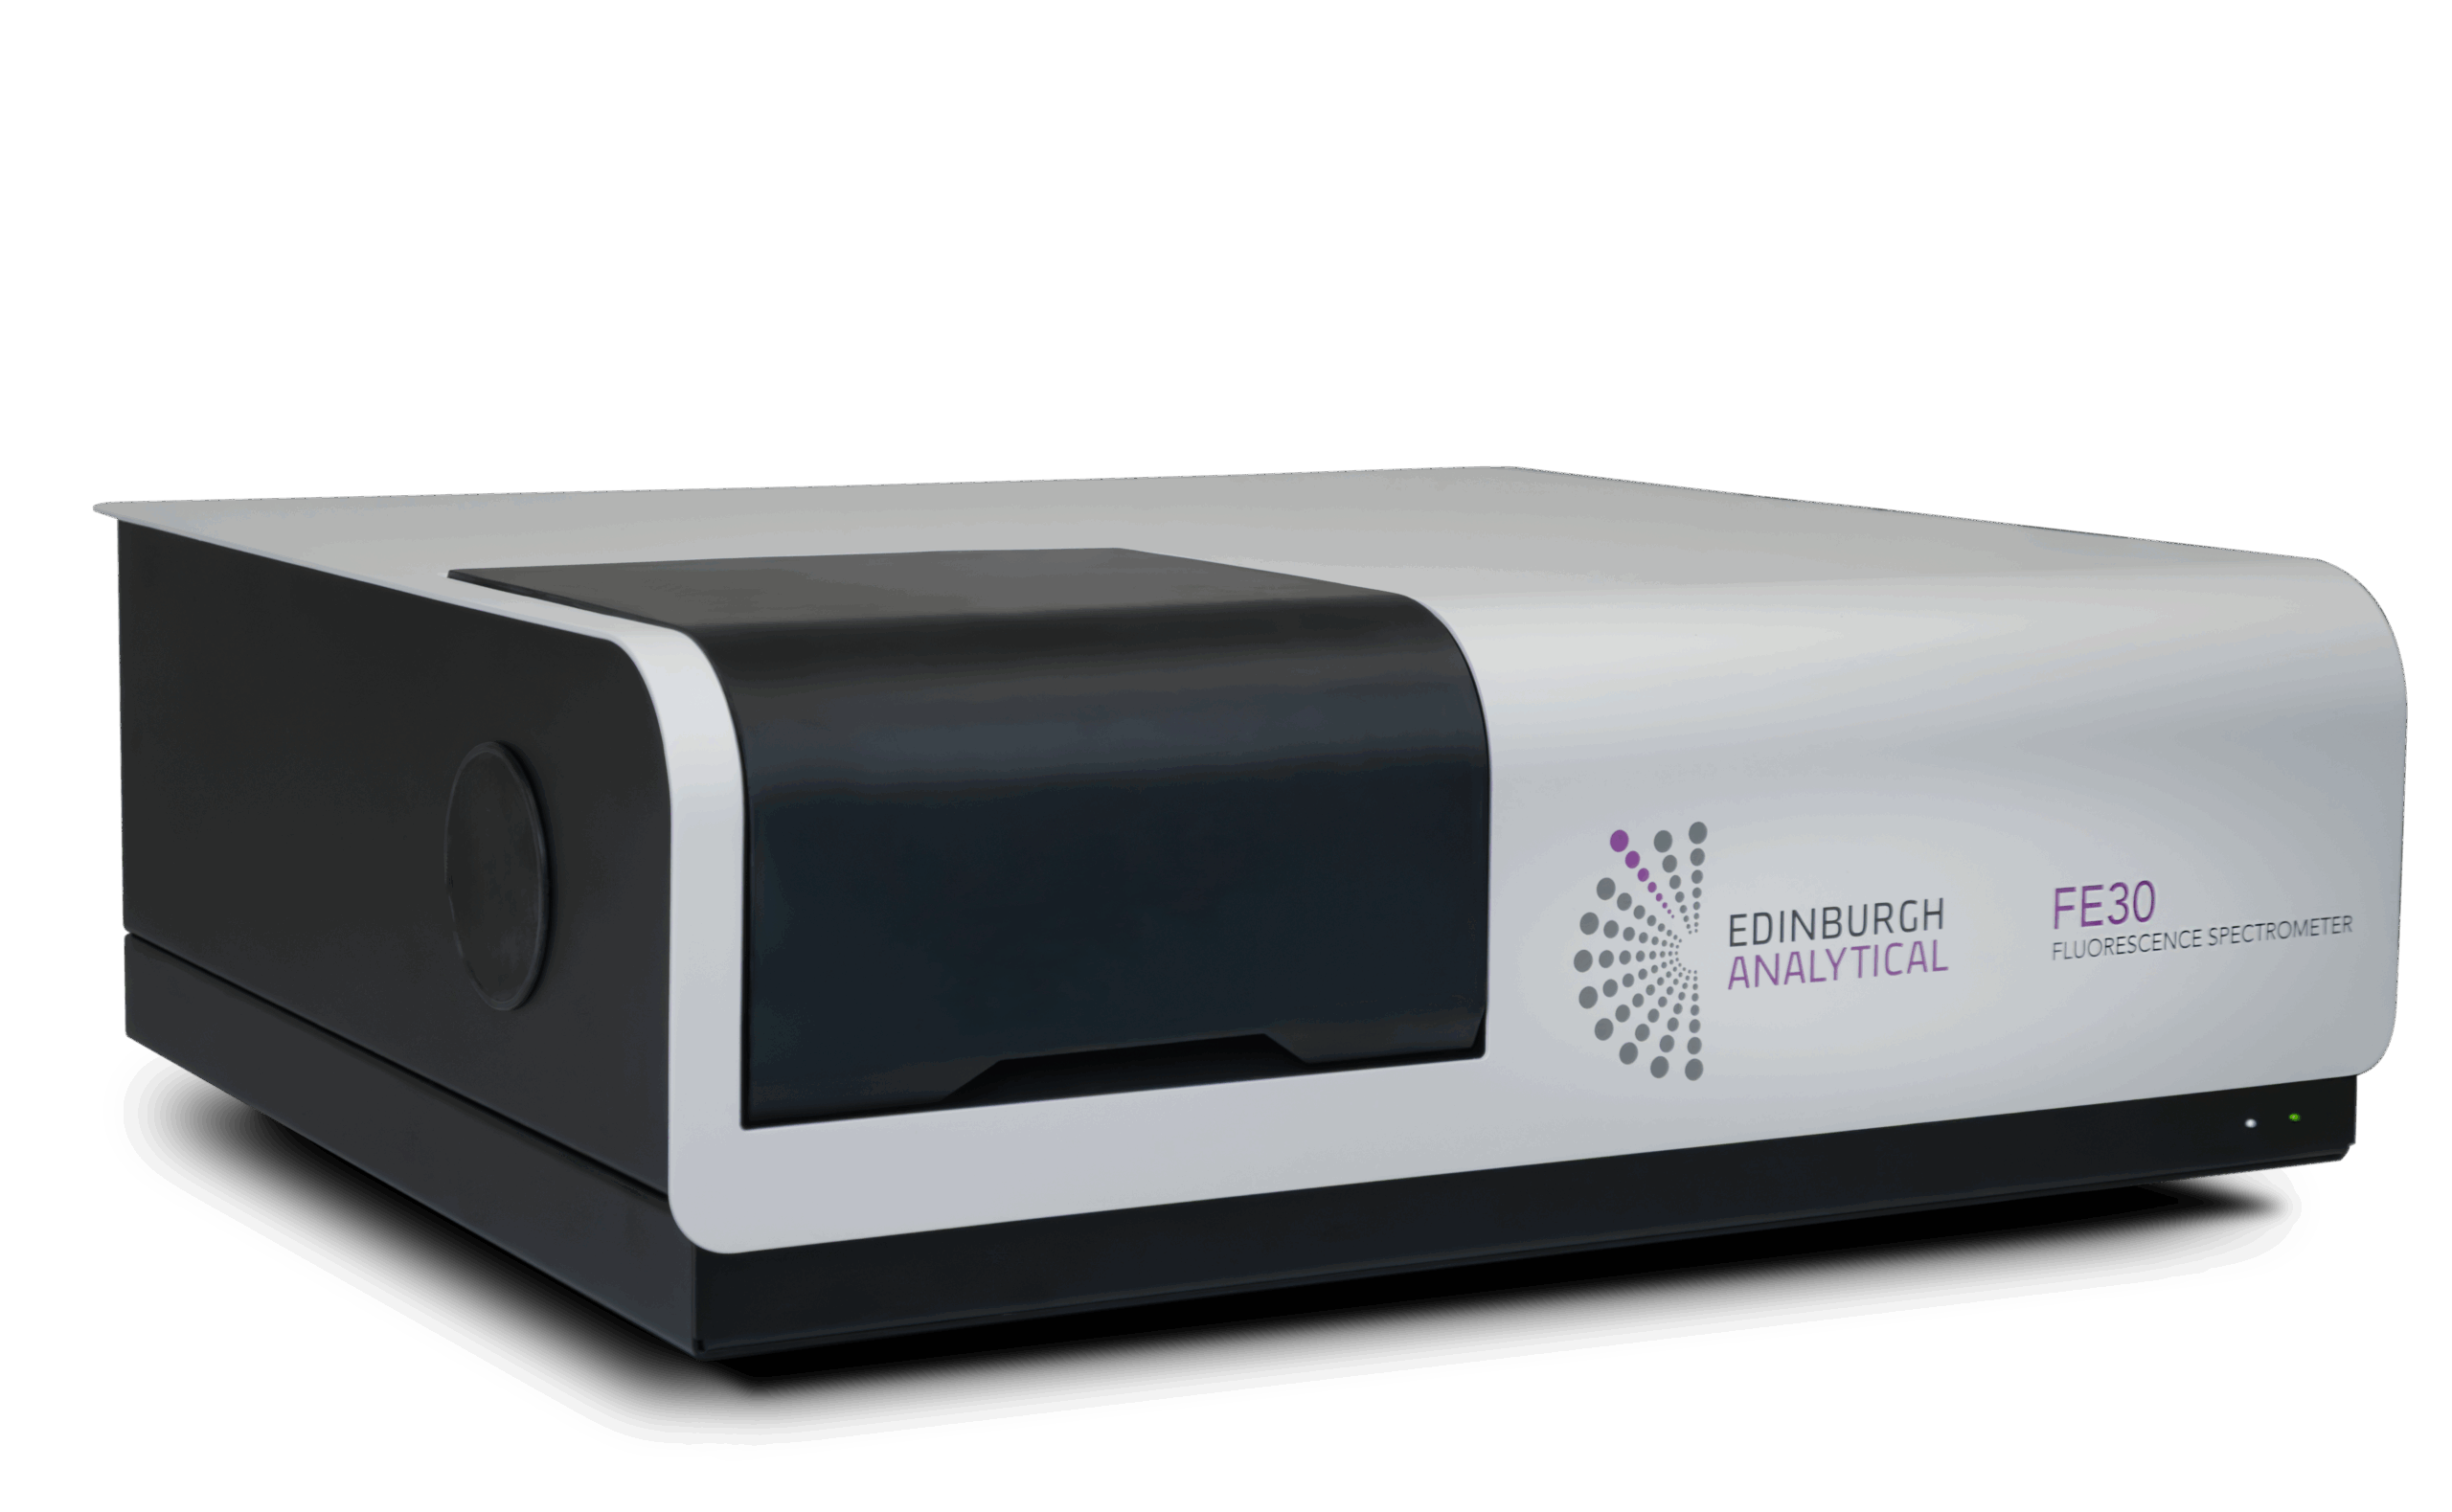
Figure 2. Edinburgh Analytical FE30 Fluorescence Spectrometer.
ExEm Map is a 3D fluorescence spectroscopy method, (aka Excitation Emission Matrix Spectroscopy, EEMs) provides a substantial amount of information regarding the properties and quantities of fluorescent groups by continuously scanning excitation and emission wavelengths. This technique serves as a valuable spectral fingerprinting method, enabling simultaneous qualitative and quantitative analysis of CDOM by assessing both the position and intensity of fluorescence peaks. It addresses the limitations of conventional fluorescence analysis. Contrast to traditional fluorescence techniques, ExEm Map can simultaneously acquire and characterise spectral peak information from various fluorescent groups within CDOM, thus offering a comprehensive view of the fluorescence properties of the substances and facilitating detailed qualitative and quantitative studies. This approach opens new possibilities for research on CDOM in seawater (Figure 3).
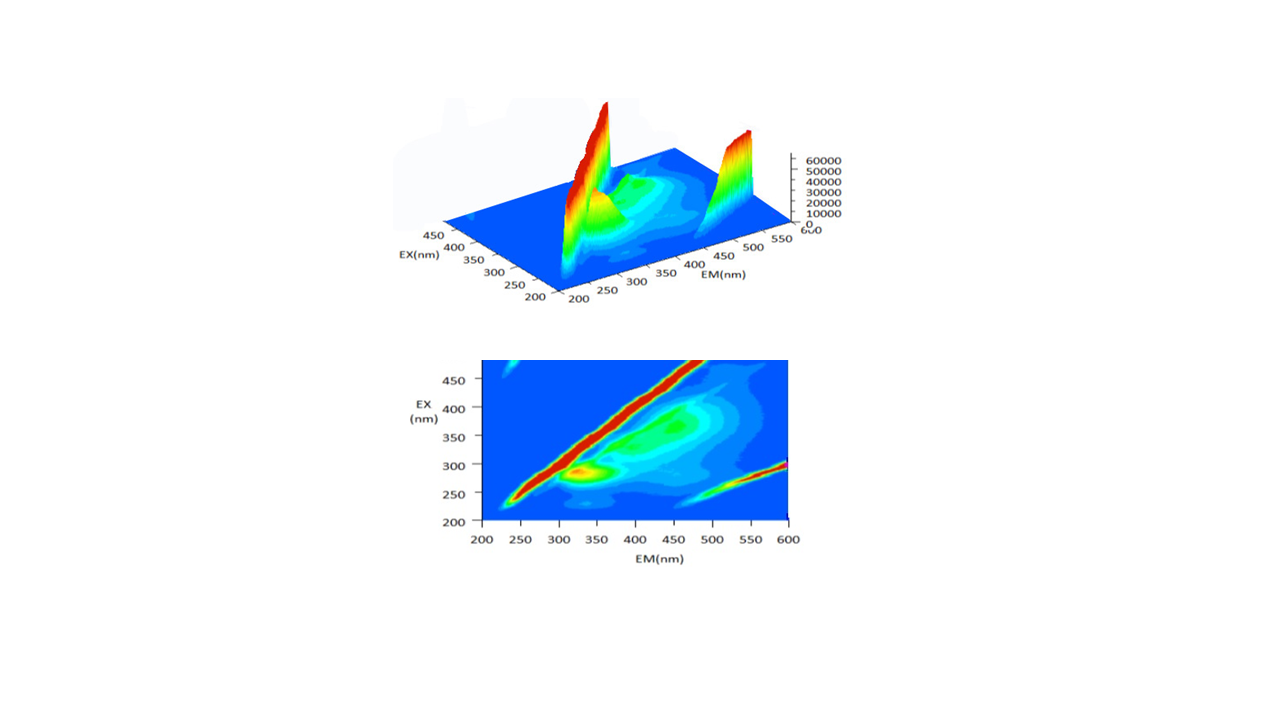
Figure 3. The effect of increasing particle diameter on the LSPR of spherical AuNPs.
ExEm Map has been widely applied in studies related to the fluorescence characteristics of CDOM in environmental waters, the source identification of CDOM, photochemical degradation of CDOM, and the tracing of organic pollution levels. There are ongoing reports of EEMs applications in estuaries and marine environments.
The ExEm Map function of the FE30 is well-suited for the analysis of complex fluorescent components. This technique involves collecting emission spectra of samples under various excitation conditions, necessitating the acquisition of extensive data. The scanning speed significantly influences the time required to complete the three-dimensional scan.
The FE30 offers a maximum scanning speed of 60,000 nm/min, which effectively reduces measuring time and enhances overall efficiency. This rapid scanning capability allows for comprehensive analysis while maintaining high throughput, making it an invaluable tool for studying complex fluorescence phenomena in CDOM.